Data & Research
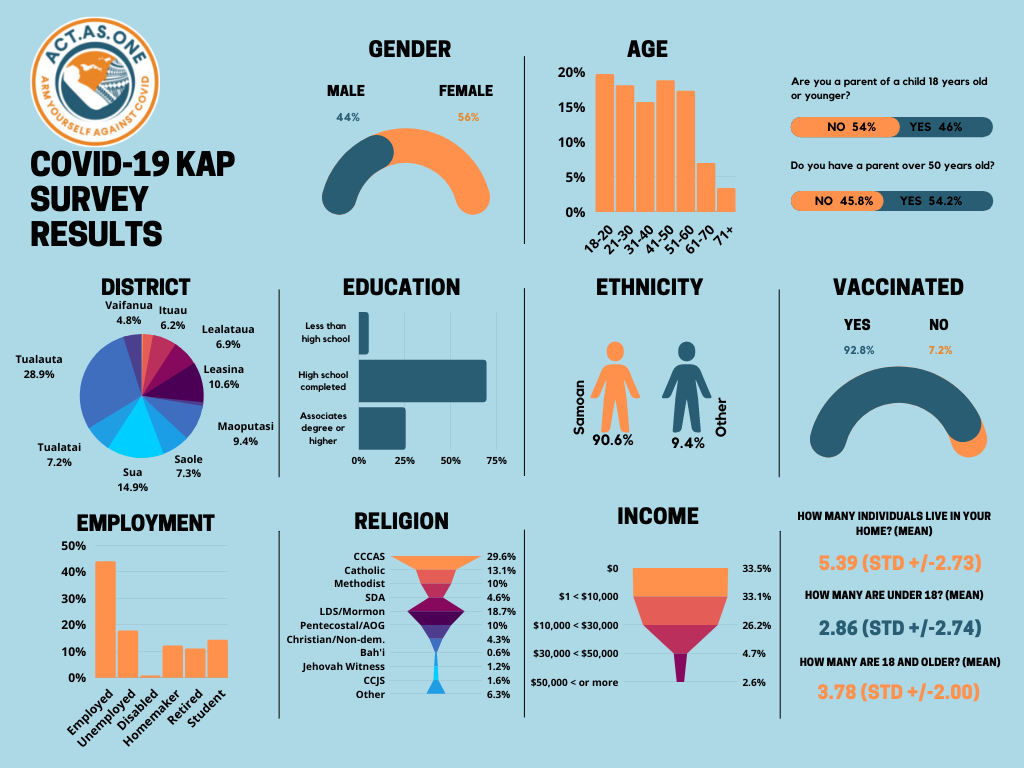
In September through October 2021, we implemented a COVID-19 knowledge, attitudes, and perceptions survey community wide to 852 adults ages 18 years old and above. Participants completed 17 demographic questions, 15 Likert scale (strongly agree, agree, neither agree or disagree, disagree, or strongly disagree), 7 dichotomous (yes/no), and 5 multiple-choice. Topics included COVID-19 confidence, hesitancy, and health communication. We analyzed demographics using descriptive statistics to calculate the mean and standard deviation. Frequencies and percentages were used for describing the categorically measured variables. All statistical tests were significant at a two-tailed p value less than 0.05.
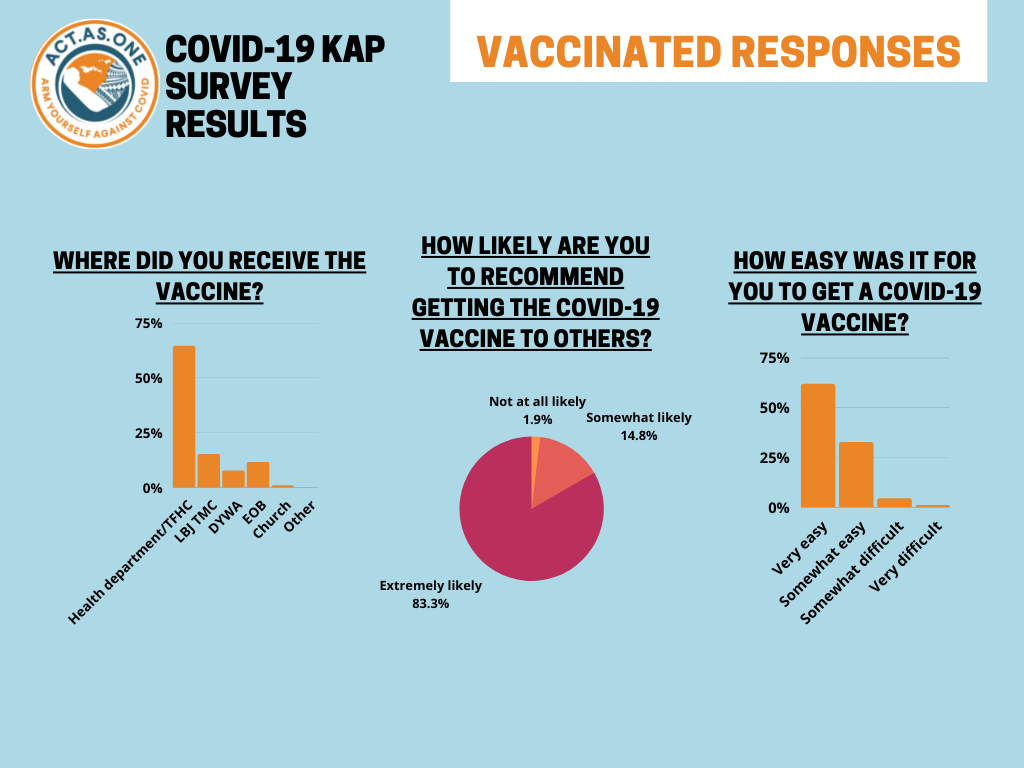
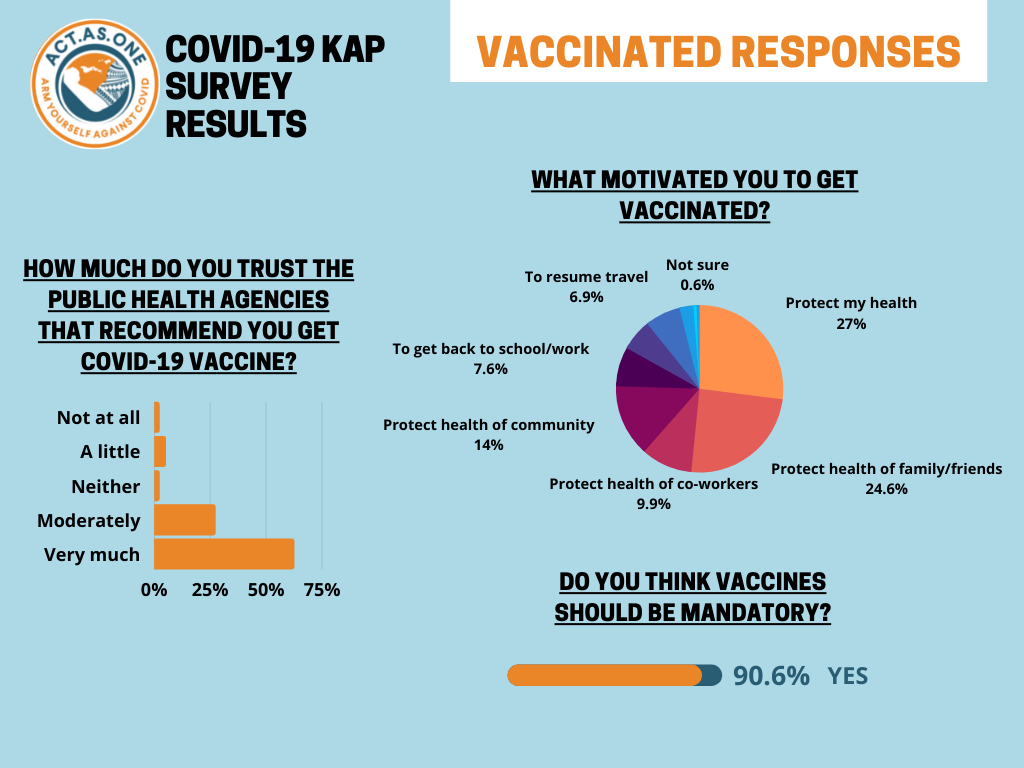
A majority of respondents (92.8%) had already been fully vaccinated. Almost half (45.9%) reported to be a parent of a child younger than 18 years old and 90.0% would allow their children to receive a vaccine, if eligible. The three top motivating factors for those who were vaccinated were: protect my health (79.3%), protect health of family/friends (72.4%), and protect health of the community (41.2%). The Multivariate Logistic Regression Model was used to determine associations between predictors and COVID vaccination with odds ratios and confidence interval of 95%. Those who found it “very easy” to get a vaccine were 68 times more likely to get a vaccine than those who found it difficult. Respondents who knew where to get accurate and timely information were 4.6 times more to obtain a vaccine versus those who were unsure. Respondents who trust in DOH and LBJ recommendations to get a vaccine were 6.8 times more likely to get vaccinated than those who did not at all.
The infographics below are visual depiction of the above-mentioned data and other responses collected from our survey. We promote data sharing to encourage collaboration and evidence-based decision making. If you would like to find out more information about our survey, click here to download a copy. If you are interested in reviewing the dataset to conduct your own analysis, please click here to complete a data request form.
Infographics –
1. Demographic information
2. Experiences of those who have received the vaccine.
4. Information and concerns of those who have not received the vaccine.

3. Opinions of those who received the vaccine.
5. Opinions of those who have not received the vaccine.


